/af6a0a24-206f-40dd-a85e-7bc53d4afda1.png "iq chart and standard scores | understanding iq scores and deviations Main Image")
IQ Chart and Standard Scores | Understanding IQ Scores and Deviations
Review Rating Score
If you're curious about your intelligence quotient (IQ) score, you may have come across IQ charts that depict the average scores for different age groups. These charts are based on standardized IQ tests that measure cognitive abilities such as problem-solving, reasoning, and memory. In this article, we'll take a closer look at IQ charts, how they work, and what they can tell us about our intelligence.
Understanding IQ Scores
IQ scores are determined through standardized tests that are designed to assess an individual's cognitive abilities relative to others in their age group. The most commonly used test is the Wechsler Adult Intelligence Scale (WAIS) for adults and the Wechsler Intelligence Scale for Children (WISC) for children. These tests provide a composite score that represents an individual's overall cognitive ability.
The average IQ score is 100, with most people falling within the range of 85-115. Scores above 115 are considered above average, while scores below 85 are considered below average. Scores above 130 indicate high intelligence, while scores below 70 indicate intellectual disability.
Using IQ Charts
IQ charts are visual representations of IQ scores that help to put individual scores in context. They are typically organized into age groups to account for the fact that intelligence tends to increase with age until it plateaus in adulthood. An IQ chart will plot the average score for each age group and show the standard deviation, which is a measure of how much scores vary from the average. A standard deviation of 15 is common for IQ tests.
For example, if the average IQ score for 10-year-olds is 100 with a standard deviation of 15, then a score of 115 would be one standard deviation above the average and considered above average, while a score of 85 would be one standard deviation below the average and considered below average.
Get Your Free IQ Chart PDF Download
Interested in finding out more about IQ scores and how they're measured? Download our free IQ chart PDF from BizzLibrary.com. Our easy-to-read chart provides a clear overview of IQ scores by age group, as well as explanations of what those scores mean in terms of cognitive ability.
BizzLibrary.com offers a wide range of helpful documents and templates for personal and professional use, including resumes, cover letters, business plans, and more. Visit our site today to download your free IQ chart PDF and start exploring all that we have to offer!
Is the template content above helpful?
Thanks for letting us know!
Reviews
Shawnna Mays(7/4/2023) - DEU
Thank you for the Doc!!
Last modified
Our Latest Blog
- A Guide to Make a Business Plan That Really Works
- The Importance of Vehicle Inspections in Rent-to-Own Car Agreements
- Setting Up Your E-mail Marketing for Your Business: The Blueprint to Skyrocketing Engagement and Sales
- The Power of Document Templates: Enhancing Efficiency and Streamlining Workflows
Template Tags
Need help?
We are standing by to assist you. Please keep in mind we are not licensed attorneys and cannot address any legal related questions.
-
Chat
Online - Email
Send a message
You May Also Like
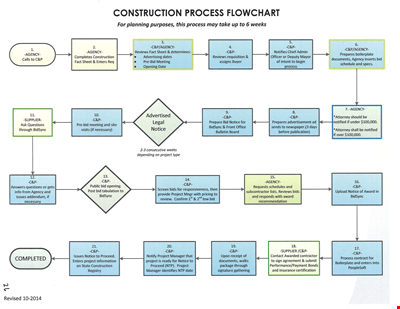
Create Professional Project Flow Charts with our Free Template
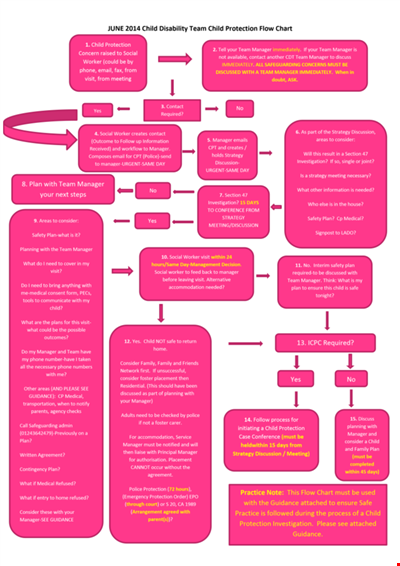
Social Event Flow Chart Template - Plan, Organize, and Execute Memorable Events
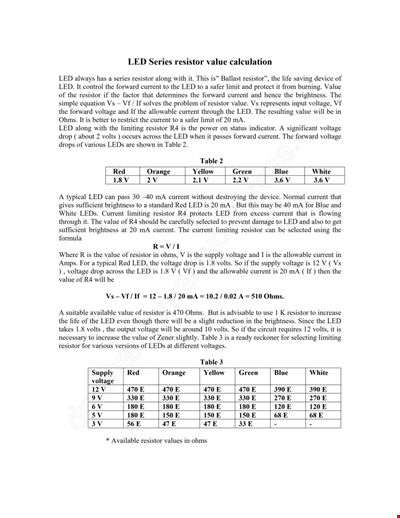
Calculation Resistor Value Chart For Led

Reward Template for Kids | Printable Behavior Chart & Chore Chart

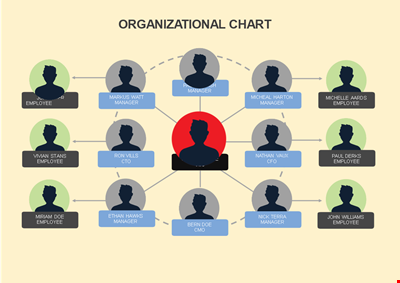
Organizational Chart Template, Editable Org Chart, Free Download
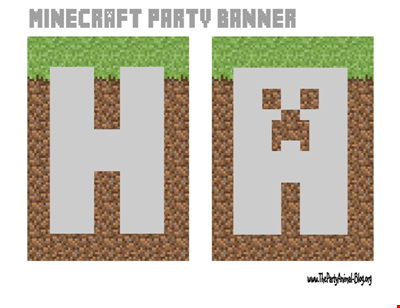
Minecraft Birthday Banner - Buy Customizable Party Decorations
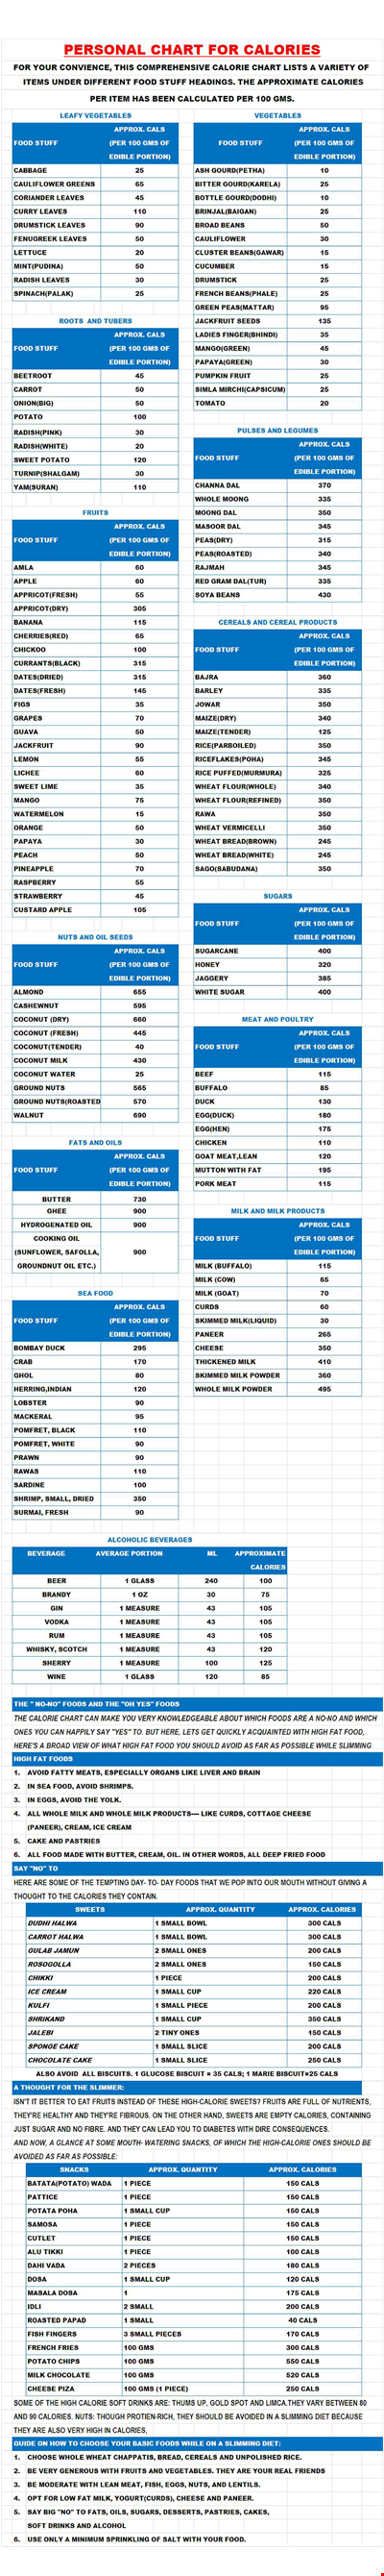
Personal Food Calorie Chart
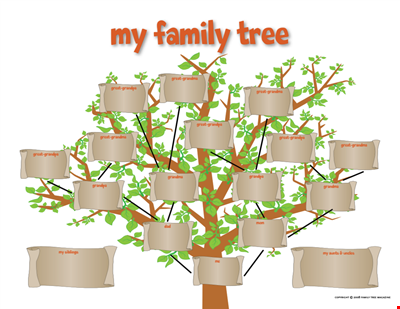
Family Tree Chart For Kids
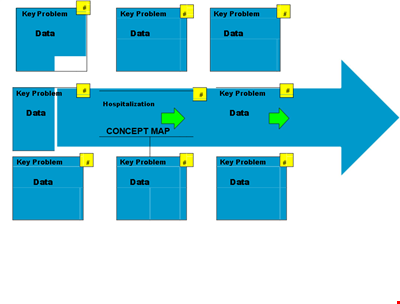
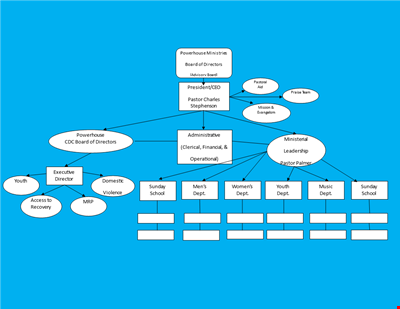
Create Organized Concepts with Our Concept Map Template - Solve Problems & Analyze Reasons
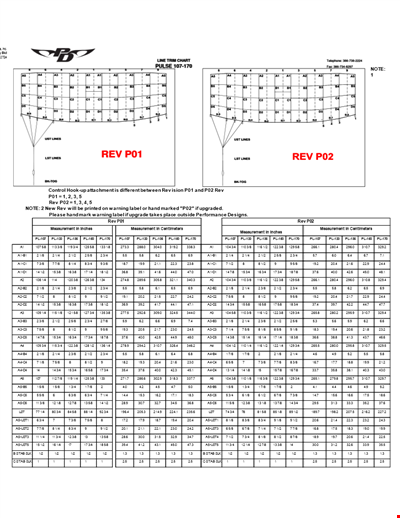
Find the Ideal Pulse Rate with Our Chord Tool
Org Chart Template Word
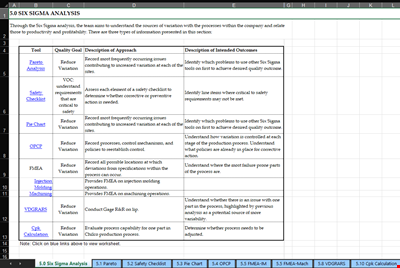
Understand and Reduce Process Variation with a Pareto Chart
Create an Organizational Chart Template - Easily Visualize Your Company Hierarchy

Free Vintage Family Tree Template
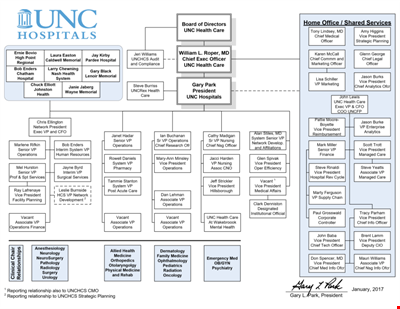
Large Hospital Organizational Chart Template - Download Now
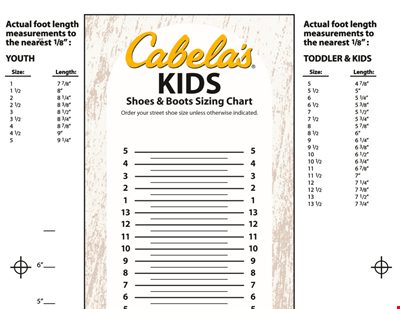
Printable Shoe Size Chart for Kids: Find the Perfect Fit for Your Little Ones