/5bed9856-1078-4e10-8735-1b3abfe7df82.png)
Create impactful Pareto Charts with ease
Review Rating Score
A Pareto chart is a graphical representation of the 80/20 rule, where 80% of the effects come from 20% of the causes. It is a powerful tool for visualizing data and identifying the most significant factors contributing to a problem. If you want to create a Pareto chart for your business or organization, you're in luck! At BizzLibrary.com, we offer a downloadable Pareto Chart template that you can use to analyze your data and make data-driven decisions.
What is a Pareto Chart?
A Pareto chart is a combination of a bar graph and a line graph. It shows both the frequency of occurrences for different categories and the cumulative percentage of the total. The categories are typically arranged in descending order of frequency, with the most significant contributor at the top.
The Pareto chart is named after Vilfredo Pareto, an Italian economist and sociologist who observed that 80% of Italy's wealth was owned by 20% of the population. The Pareto principle, also known as the 80/20 rule, has since been applied to various fields and is commonly used in quality control, marketing, and management.
How to Create a Pareto Chart
Creating a Pareto chart is easy with our Pareto Chart template, available for download in XLSX format. Simply follow these steps:
- Enter Your Data: Input your data into the designated columns on the template, including the categories and their frequencies. Make sure your data is complete and accurate to ensure meaningful insights.
- Sort Your Data: Sort your data in descending order of frequency, from the highest to the lowest. This will help you identify the most significant contributors to your problem or situation.
- Create Your Chart: With your data sorted, use the chart wizard to create a bar graph for the frequency and a line graph for the cumulative percentage. The two graphs should be aligned vertically, with the frequency bars on the left y-axis and the cumulative percentage line on the right y-axis.
- Analyze Your Results: Interpret your Pareto chart to identify the 20% of categories that contribute to 80% of the overall effect. This will help you prioritize your actions and resources to address the most critical issues.
Get Your Pareto Chart Template
Ready to create your Pareto chart? Download our Pareto Chart template in XLSX format now and start analyzing your data like a pro. At BizzLibrary.com, we offer a wide range of business document templates, including charts, graphs, and dashboards. Visit our website today to explore our collection and take your data analysis to the next level.
Remember, analyzing your data is the key to making informed decisions and achieving success in your business or organization. Download our Pareto Chart template today and get started!
Is the template content above helpful?
Thanks for letting us know!
Reviews
Hui Forbes(6/28/2023) - DEU
Thank you for this document
Author. Content was provided by:
Elizabeth Davis
Elizabeth is from the sunny desert city of Phoenix, Arizona. She is thrilled to connect with professionals and like-minded individuals who share a passion for social technologies, content creation, and the exciting possibilities that AI brings to the world of social media. Her hobbies are hiking, climbing, and horse riding. Elizabeth has a master's degree in Social Technologies that she received at the ASU (Arizona State University). As a freelancer, she mostly contributes content related to IT. This includes articles on templates and forms provided by our community.
Follow Elizabeth
Last modified
Our Latest Blog
- The Importance of Vehicle Inspections in Rent-to-Own Car Agreements
- Setting Up Your E-mail Marketing for Your Business: The Blueprint to Skyrocketing Engagement and Sales
- The Power of Document Templates: Enhancing Efficiency and Streamlining Workflows
- Writing a Great Resume: Tips from a Professional Resume Writer
Template Tags
Need help?
We are standing by to assist you. Please keep in mind we are not licensed attorneys and cannot address any legal related questions.
-
Chat
Online - Email
Send a message
You May Also Like
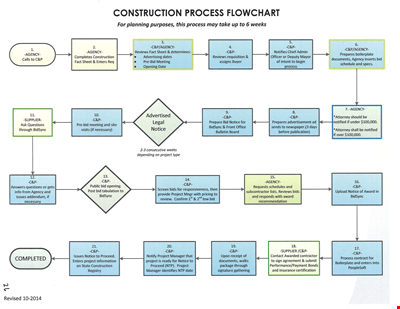
Create Professional Project Flow Charts with our Free Template
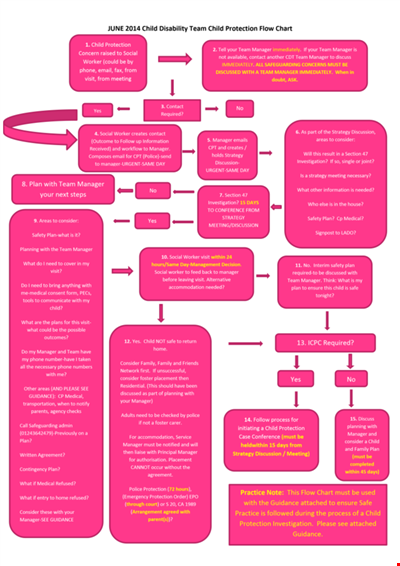
Social Event Flow Chart Template - Plan, Organize, and Execute Memorable Events
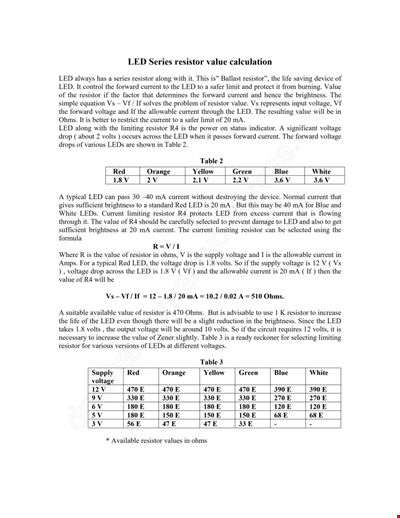
Calculation Resistor Value Chart For Led

Reward Template for Kids | Printable Behavior Chart & Chore Chart

Organizational Chart Template, Editable Org Chart, Free Download

Minecraft Birthday Banner - Buy Customizable Party Decorations

Personal Food Calorie Chart
Family Tree Chart For Kids
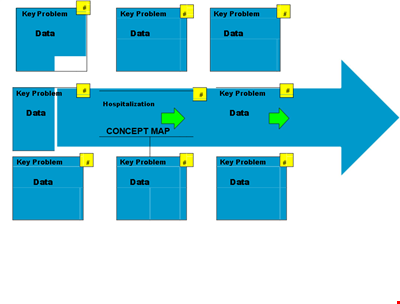
Create Organized Concepts with Our Concept Map Template - Solve Problems & Analyze Reasons
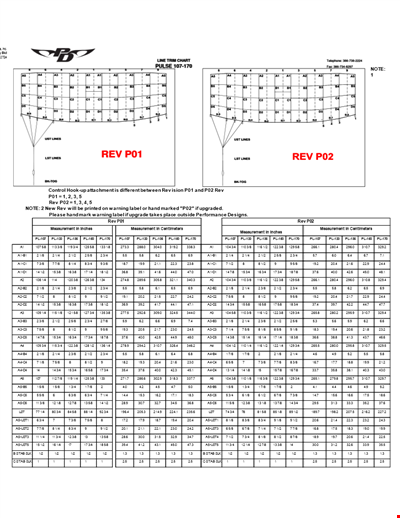
Find the Ideal Pulse Rate with Our Chord Tool
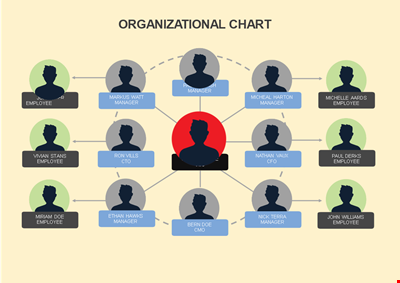
Org Chart Template Word
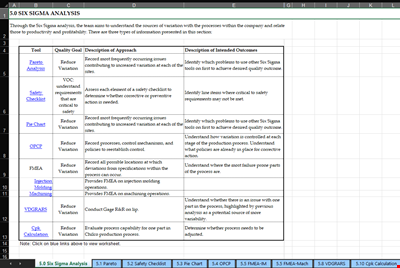
Understand and Reduce Process Variation with a Pareto Chart
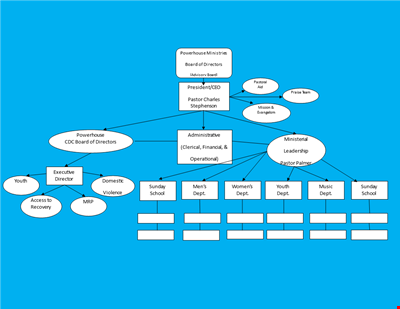
Create an Organizational Chart Template - Easily Visualize Your Company Hierarchy

Free Vintage Family Tree Template
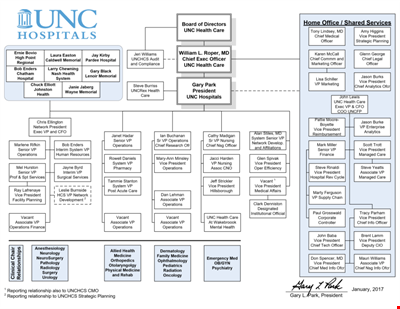
Large Hospital Organizational Chart Template - Download Now
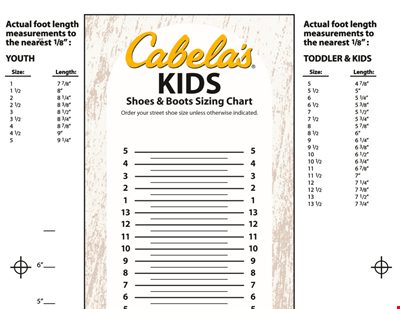
Printable Shoe Size Chart for Kids: Find the Perfect Fit for Your Little Ones