/a509f6c3-8ce2-4ed2-af3d-1a2a19800e57.png "example of financial data visualization: improve your budget with interactive charts Main Image")
Example of Financial Data Visualization: Improve Your Budget with Interactive Charts
Review Rating Score
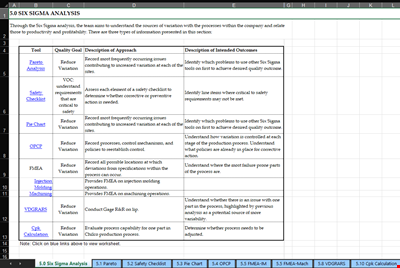
Are you looking for a powerful financial data visualization example to effectively analyze and present your budget data? BizzLibrary.com has just what you need! Our Financial Data Visualization Example is a comprehensive chart that will help you visualize and understand your financial information with ease.
Why is Data Visualization Important?
Data visualization plays a crucial role in understanding complex financial data at a glance. Instead of sifting through endless spreadsheets and numbers, charts and graphs allow you to spot trends, identify patterns, and make informed decisions. Here's why data visualization is essential for financial analysis:
- Clarity and Understanding: Visual representations help simplify complex financial information, making it easier to comprehend and interpret. Charts and graphs enable quick identification of key insights, trends, and outliers.
- Improved Decision-Making: With data presented in visual form, decision-makers can gain a holistic view of the financial situation. This empowers them to make more informed decisions based on accurate and up-to-date information.
- Identification of Opportunities and Risks: Data visualization allows you to identify potential opportunities for growth or areas of concern within your budget. It enables you to proactively address risks and take advantage of favorable trends.
- Efficient Communication: Visual representations of financial data facilitate effective communication with stakeholders. Whether it's presenting to clients, investors, or internal teams, charts and graphs make it easier to convey complex financial information clearly.
Download Our Financial Data Visualization Example
Ready to take your financial analysis to the next level? You can download our Financial Data Visualization Example in PDF format from BizzLibrary.com. This example chart is designed to help you transform raw budget data into a visually appealing and informative representation.
Visit our website and explore our vast collection of document templates, including financial data analysis tools, charts, and more. Trust BizzLibrary.com to provide you with the resources you need to make data-driven decisions and effectively communicate your financial insights!
Is the template content above helpful?
Thanks for letting us know!
Reviews
Tuyet Farrell(9/19/2023) - DEU
Endorsed the letter and page to a friend who can use it.
Last modified
Our Latest Blog
- A Guide to Make a Business Plan That Really Works
- The Importance of Vehicle Inspections in Rent-to-Own Car Agreements
- Setting Up Your E-mail Marketing for Your Business: The Blueprint to Skyrocketing Engagement and Sales
- The Power of Document Templates: Enhancing Efficiency and Streamlining Workflows
Template Tags
Need help?
We are standing by to assist you. Please keep in mind we are not licensed attorneys and cannot address any legal related questions.
-
Chat
Online - Email
Send a message
You May Also Like
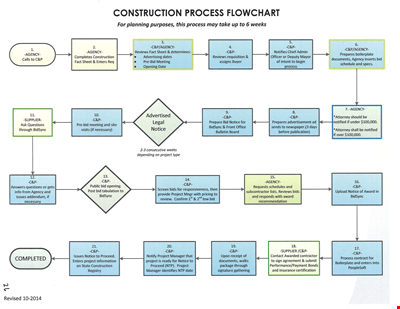
Create Professional Project Flow Charts with our Free Template
Social Event Flow Chart Template - Plan, Organize, and Execute Memorable Events
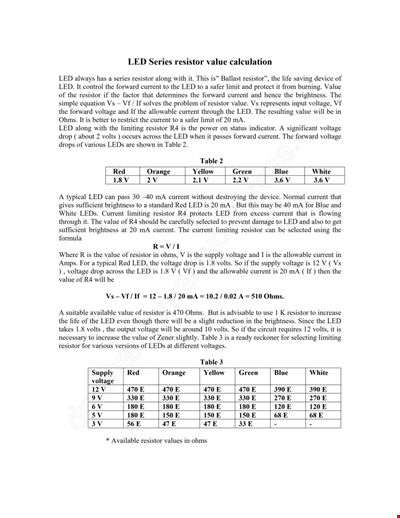
Calculation Resistor Value Chart For Led

Reward Template for Kids | Printable Behavior Chart & Chore Chart

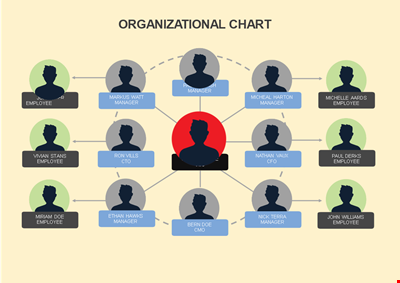
Organizational Chart Template, Editable Org Chart, Free Download

Minecraft Birthday Banner - Buy Customizable Party Decorations
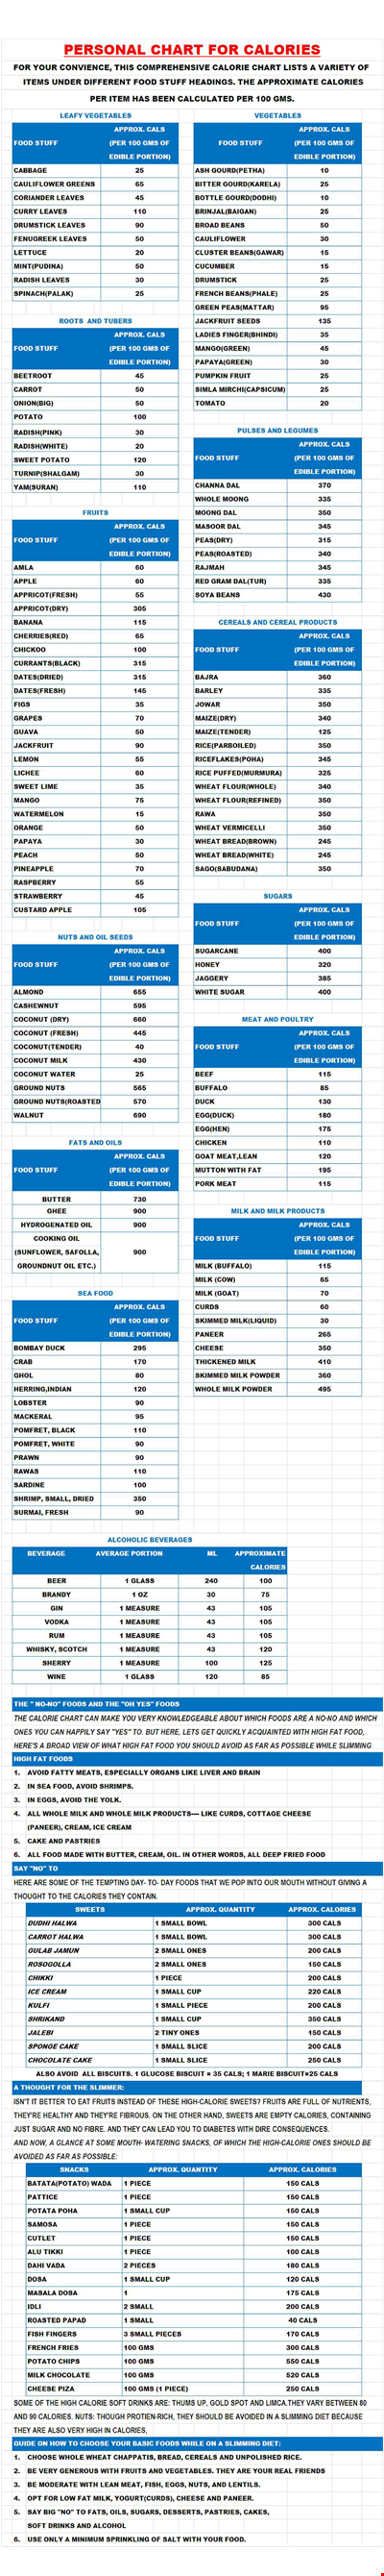
Personal Food Calorie Chart
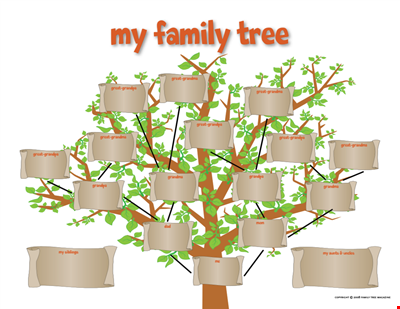
Family Tree Chart For Kids
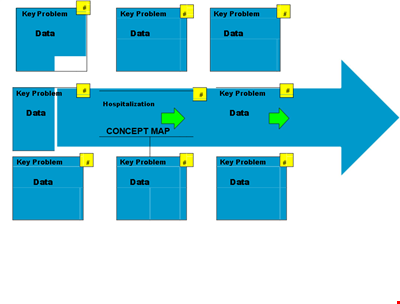
Create Organized Concepts with Our Concept Map Template - Solve Problems & Analyze Reasons
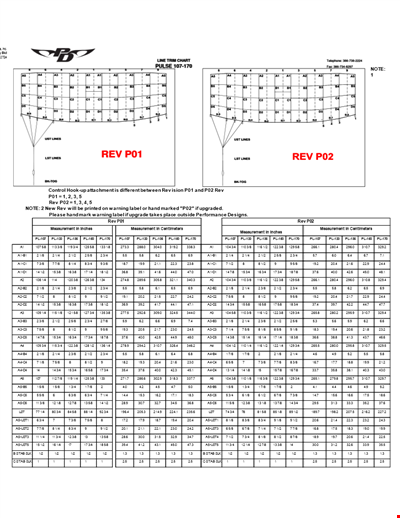
Find the Ideal Pulse Rate with Our Chord Tool
Org Chart Template Word
Understand and Reduce Process Variation with a Pareto Chart
Create an Organizational Chart Template - Easily Visualize Your Company Hierarchy

Free Vintage Family Tree Template
Large Hospital Organizational Chart Template - Download Now
Printable Shoe Size Chart for Kids: Find the Perfect Fit for Your Little Ones