/b9a6356e-1c57-45e8-974b-ae0b6b62c8c0.png "plot venn diagram example Main Image")
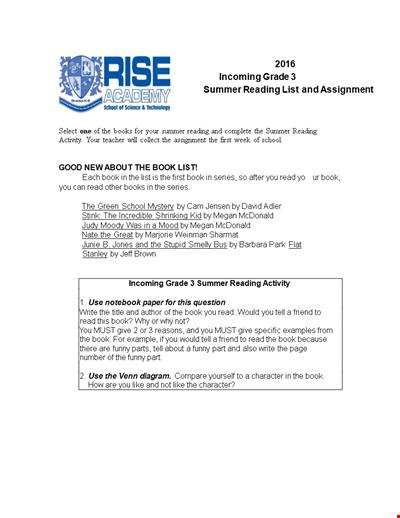
Plot Venn Diagram Example
Review Rating Score
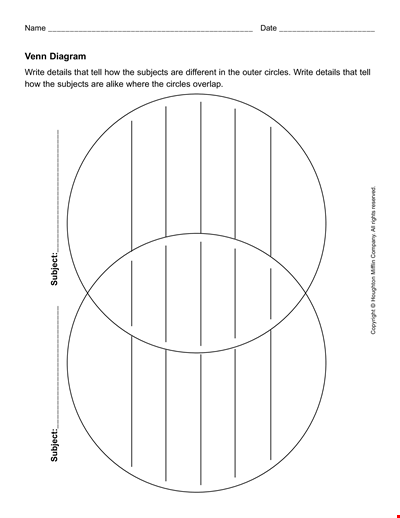
Are you looking for an example of a Venn diagram to visualize data and illustrate relationships? Look no further! At BizzLibrary.com, we provide a free and downloadable Venn diagram example in PDF format.
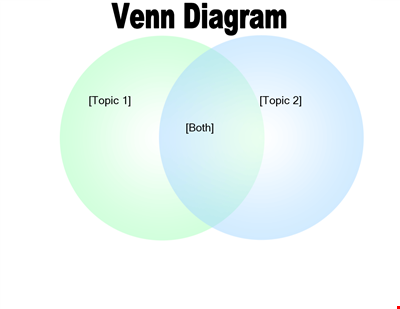
What is a Venn Diagram?
A Venn diagram is a graphical representation of the relationships between different sets of data. It consists of overlapping circles or ellipses, where each circle represents a set and the overlapping regions show the common elements between these sets. Venn diagrams are commonly used to demonstrate logical relationships, analyze data, and compare different groups or categories.
How to Plot a Venn Diagram
To plot a Venn diagram, follow these simple steps:
- Identify the Sets: Determine the different sets or categories that you want to compare or analyze. For example, if you want to analyze the frequency of three different marketing channels (social media, email, and search engine) in driving total sales.
- Construct the Circles: Draw circles or ellipses on a piece of paper or using a software tool. Each circle represents a set, and the overlapping regions represent the common elements between these sets.
- Add Data: Fill in the relevant data or values in each set. For example, if you have data on the number of sales generated from each marketing channel, enter those values in the corresponding sets.
- Calculate Overlaps: Determine the intersections and overlaps between the sets. In our example, you would calculate the overlap between each pair of sets to see the total number of sales generated by combinations of marketing channels.
- Label and Interpret: Label each section and provide a brief interpretation of the results. Use shading or different colors to distinguish the different areas of the diagram for clarity.
Download the Venn Diagram Example
Ready to plot your Venn diagram? Download our Venn diagram example in PDF format from BizzLibrary.com. It provides a visual representation of the relationships between different sets and can be customized to suit your specific data and analysis needs.
Visit our website now to access a wide range of business templates, including Venn diagrams, charts, and graphs, to enhance your data visualization and decision-making processes. Download our Venn diagram example and start analyzing your data effectively!
Is the template content above helpful?
Thanks for letting us know!
Reviews
Ahmad Leblanc(8/3/2023) - NZL
Endorsed the file and website to my relations and friends
Author. Content was provided by:
Elizabeth Davis
Elizabeth is from the sunny desert city of Phoenix, Arizona. She is thrilled to connect with professionals and like-minded individuals who share a passion for social technologies, content creation, and the exciting possibilities that AI brings to the world of social media. Her hobbies are hiking, climbing, and horse riding. Elizabeth has a master's degree in Social Technologies that she received at the ASU (Arizona State University). As a freelancer, she mostly contributes content related to IT. This includes articles on templates and forms provided by our community.
Follow Elizabeth
Last modified
Our Latest Blog
- A Guide to Make a Business Plan That Really Works
- The Importance of Vehicle Inspections in Rent-to-Own Car Agreements
- Setting Up Your E-mail Marketing for Your Business: The Blueprint to Skyrocketing Engagement and Sales
- The Power of Document Templates: Enhancing Efficiency and Streamlining Workflows
Template Tags
Need help?
We are standing by to assist you. Please keep in mind we are not licensed attorneys and cannot address any legal related questions.
-
Chat
Online - Email
Send a message
You May Also Like
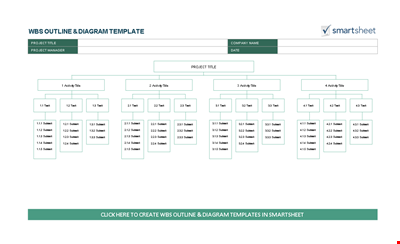
Work Breakdown Structure Template - Project Outline & Diagram
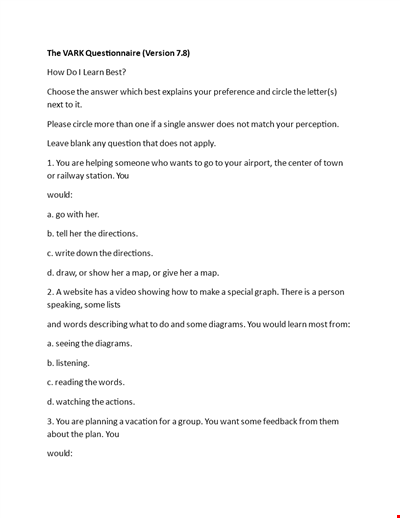
Create Effective Questionnaires - Learn with Diagrams | Category: Templates
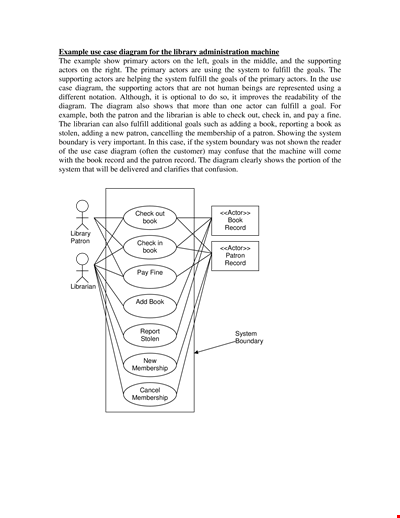
Effective Use Case Template for System: Organize Actions and Actors with Diagram
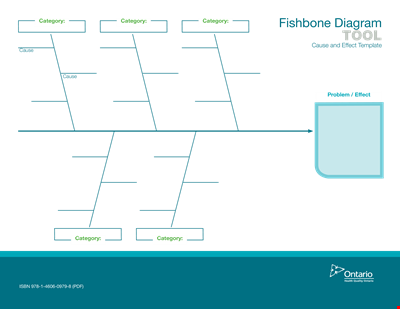
Fishbone Diagram Template - Organize Categories, Causes, and Effects
Funny Venn Diagram Example for Reading and Summer
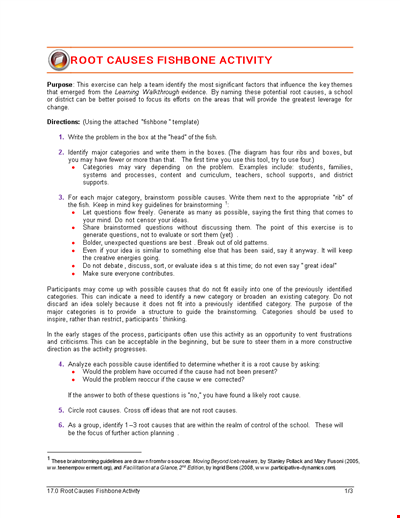
Download our Fishbone Diagram Template for Effective Categorization of Causes
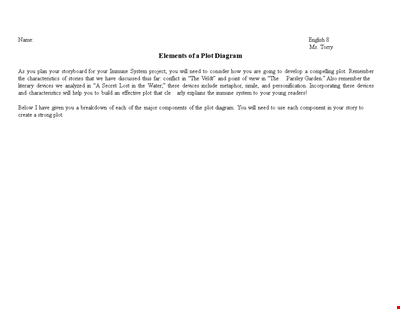
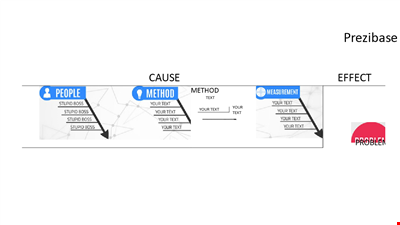
Create Compelling and Effective Plots with Our Plot Diagram Template - Devices and Immune included
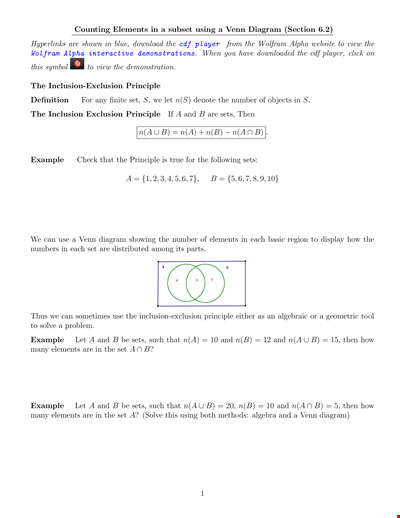
Subset Venn Diagram Example

Funny Venn Diagram Example
Use Case Venn Diagram Example
Cause and Effect Diagrams | Fishbone Diagram Template
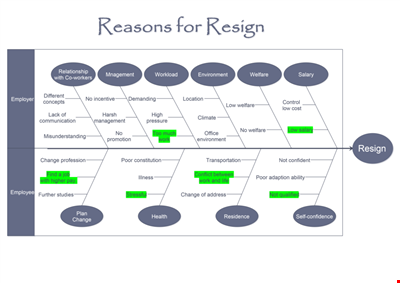
Fishbone Diagram Template for Effective Problem-Solving

Fishbone Diagram Template for Customer Satisfaction
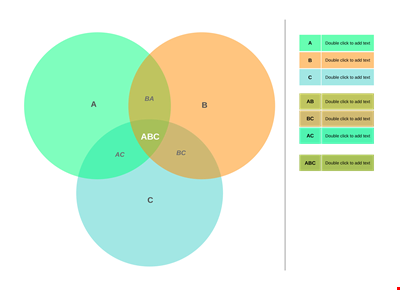
Create Custom Venn Diagrams | Easily Design and Save
Professional Venn Diagrams with our Customizable Template
Organized Visual Displays with Our Venn Diagram Template