/b6aa1c75-d34d-4755-9f04-837995d1f213.png)
Google Data Visualization Example: Create Dynamic Tables with Fusion Tables
Review Rating Score
Google offers a powerful suite of data visualization tools that can help businesses and individuals make sense of complex data sets. Whether you're looking to create interactive charts, maps, or dashboards, Google has you covered. In this article, we will explore some examples of Google data visualization and how they can benefit your data analysis efforts.
Google Fusion Tables
One of the popular tools offered by Google is Fusion Tables. Fusion Tables is a web-based data management and visualization tool that allows users to upload, visualize, and share large data sets. It provides a simple and intuitive interface for creating visualizations, such as charts, maps, and timelines, directly from your data.
Google Data Studio
Google Data Studio is another powerful tool for data visualization. It enables users to create interactive dashboards and reports that can be easily shared and collaborated on. With Data Studio, you can connect to various data sources, including Google Sheets, Google Analytics, and Google Ads, to create visually stunning and informative dashboards to track key metrics and trends.
Google Maps
When it comes to geographical data visualization, Google Maps is the go-to tool. Google Maps provides an excellent platform for creating custom maps based on your data. You can plot locations, visualize density, and even overlay additional layers to add context to your maps. Whether you want to visualize sales data by region or display the distribution of your customers, Google Maps offers a versatile and user-friendly solution.
Google Chart Tools
Google Chart Tools is a powerful library that allows you to create interactive and dynamic charts and graphs. You can choose from a wide range of chart types, including line charts, bar charts, pie charts, and more. With extensive customization options, you can tailor the charts to match your branding and design preferences. Google Chart Tools make it easy to represent complex data in a visually appealing and digestible format.
Get Started with Google Data Visualization
If you're ready to explore the world of Google data visualization, we've got you covered. Visit our website, BizzLibrary.com, and download our comprehensive Google Data Visualization Example document in DOCX format. This document provides step-by-step instructions and examples to help you get started with Google's data visualization tools. It's a valuable resource for anyone looking to harness the power of visualizations for effective data analysis.
Don't miss out on the opportunity to leverage Google's robust data visualization tools. Download our Google Data Visualization Example document now and take your data analysis to the next level!
Is the template content above helpful?
Thanks for letting us know!
Reviews
Tijuana Stephens(11/7/2023) - GBR
Grateful!!
Last modified
Our Latest Blog
- The Importance of Vehicle Inspections in Rent-to-Own Car Agreements
- Setting Up Your E-mail Marketing for Your Business: The Blueprint to Skyrocketing Engagement and Sales
- The Power of Document Templates: Enhancing Efficiency and Streamlining Workflows
- Writing a Great Resume: Tips from a Professional Resume Writer
Template Tags
Need help?
We are standing by to assist you. Please keep in mind we are not licensed attorneys and cannot address any legal related questions.
-
Chat
Online - Email
Send a message
You May Also Like
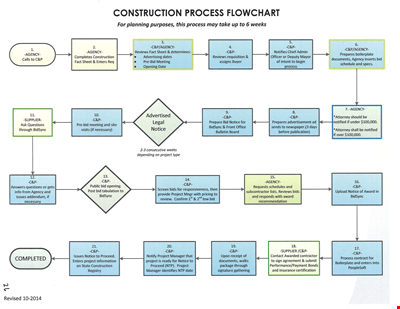
Create Professional Project Flow Charts with our Free Template
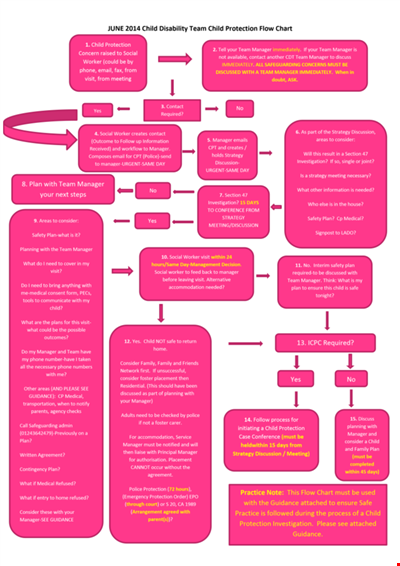
Social Event Flow Chart Template - Plan, Organize, and Execute Memorable Events
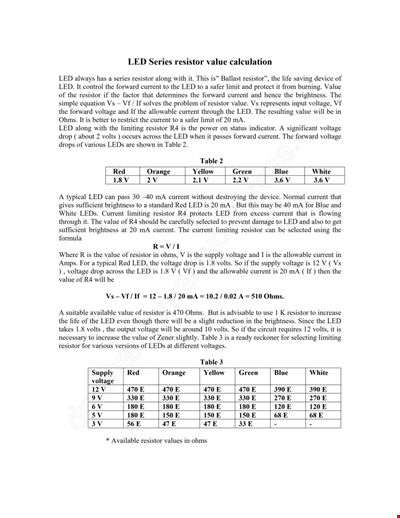
Calculation Resistor Value Chart For Led

Reward Template for Kids | Printable Behavior Chart & Chore Chart

Organizational Chart Template, Editable Org Chart, Free Download

Minecraft Birthday Banner - Buy Customizable Party Decorations

Personal Food Calorie Chart
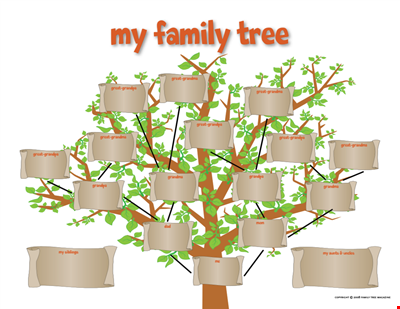
Family Tree Chart For Kids
Create Organized Concepts with Our Concept Map Template - Solve Problems & Analyze Reasons
Find the Ideal Pulse Rate with Our Chord Tool
Org Chart Template Word
Understand and Reduce Process Variation with a Pareto Chart
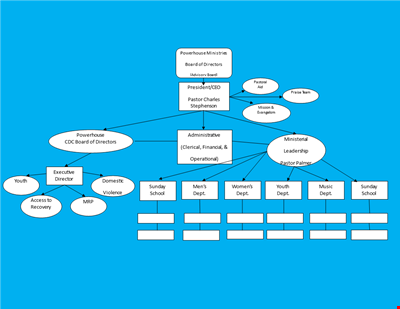
Create an Organizational Chart Template - Easily Visualize Your Company Hierarchy

Free Vintage Family Tree Template
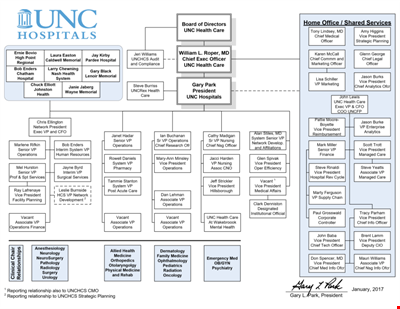
Large Hospital Organizational Chart Template - Download Now
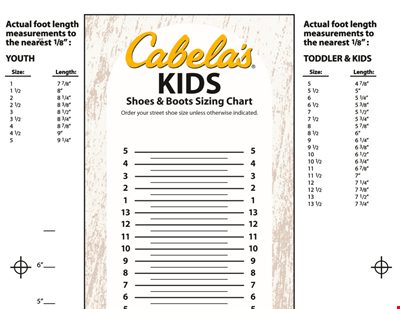
Printable Shoe Size Chart for Kids: Find the Perfect Fit for Your Little Ones