/6087d7e8-9fa1-4631-896d-c40829955871.png "sugar blood level log chart template - keep track of upper levels Main Image")
Sugar Blood Level Log Chart Template - Keep Track of Upper Levels
Review Rating Score
Do you track your blood sugar levels and need a convenient way to record and monitor your data? Look no further! At BizzLibrary.com, we offer a comprehensive Log Chart Template designed specifically for tracking blood sugar levels. With this template, you can easily keep track of your levels over time and identify any patterns or trends. Best of all, it's available for download in PDF format, making it easy to print or save for your convenience.
What is a Log Chart?
A log chart, also known as a logarithmic chart, is a graphical representation of data that uses a logarithmic scale on one or both axes. This type of chart is commonly used to display data that covers a wide range of values, such as blood sugar levels. By using a logarithmic scale, it allows for a more even distribution of data points across the chart, which can make it easier to identify trends or changes.
Why Use a Log Chart for Blood Sugar Levels?
Monitoring and managing blood sugar levels is crucial for individuals with diabetes or other health conditions. By tracking your blood sugar levels over time, you can better understand how your body responds to different factors such as diet, exercise, medication, and stress. Here's why using a log chart is beneficial:
- Better Visualization: A log chart provides a clear visual representation of your blood sugar levels, allowing you to quickly identify any spikes or dips.
- Identify Patterns and Trends: By plotting your data on a log chart, you can easily spot any recurring patterns or trends in your blood sugar levels, such as higher levels in the morning or after certain meals.
- Track Progress Over Time: By regularly updating your log chart, you can track your progress and see if any adjustments to your lifestyle or medication regimen are having a positive impact on your blood sugar levels.
- Effective Communication with Healthcare Providers: A log chart provides a visual summary of your blood sugar levels, making it easier to discuss your progress and any concerns with your healthcare team.
Download Your Log Chart Template
Ready to take control of your blood sugar monitoring? Download our Log Chart Template in PDF format today and start tracking your levels with ease. Simply visit BizzLibrary.com and access our wide range of templates, including log charts, health trackers, and more. Prioritize your health by staying organized and informed with our convenient Log Chart Template.
Is the template content above helpful?
Thanks for letting us know!
Reviews
Arlena Horne(8/3/2023) - DEU
Sublime value document
Author. Content was provided by:
Elizabeth Davis
Elizabeth is from the sunny desert city of Phoenix, Arizona. She is thrilled to connect with professionals and like-minded individuals who share a passion for social technologies, content creation, and the exciting possibilities that AI brings to the world of social media. Her hobbies are hiking, climbing, and horse riding. Elizabeth has a master's degree in Social Technologies that she received at the ASU (Arizona State University). As a freelancer, she mostly contributes content related to IT. This includes articles on templates and forms provided by our community.
Follow Elizabeth
Last modified
Our Latest Blog
- A Guide to Make a Business Plan That Really Works
- The Importance of Vehicle Inspections in Rent-to-Own Car Agreements
- Setting Up Your E-mail Marketing for Your Business: The Blueprint to Skyrocketing Engagement and Sales
- The Power of Document Templates: Enhancing Efficiency and Streamlining Workflows
Template Tags
Need help?
We are standing by to assist you. Please keep in mind we are not licensed attorneys and cannot address any legal related questions.
-
Chat
Online - Email
Send a message
You May Also Like
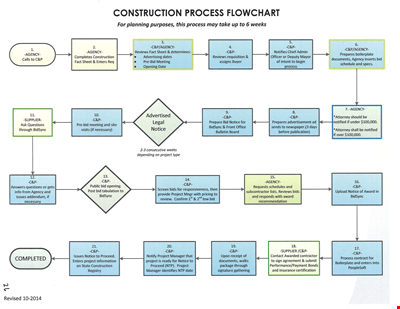
Create Professional Project Flow Charts with our Free Template
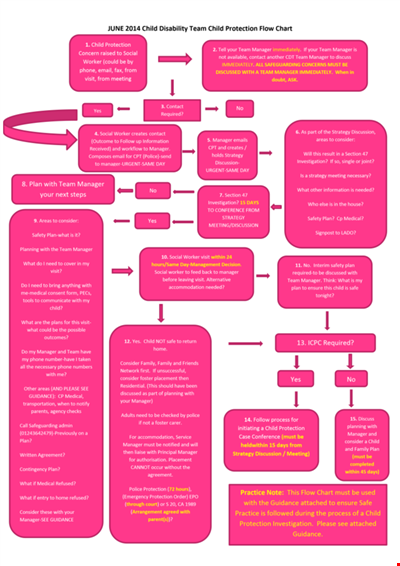
Social Event Flow Chart Template - Plan, Organize, and Execute Memorable Events
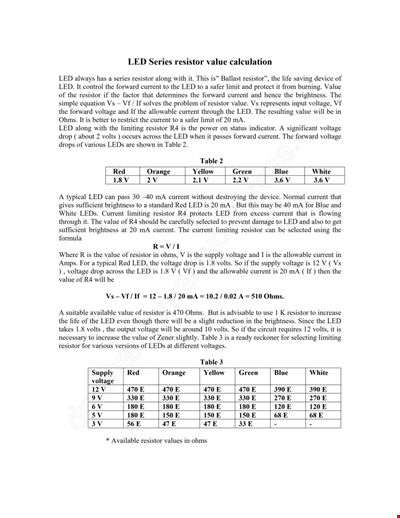
Calculation Resistor Value Chart For Led

Reward Template for Kids | Printable Behavior Chart & Chore Chart

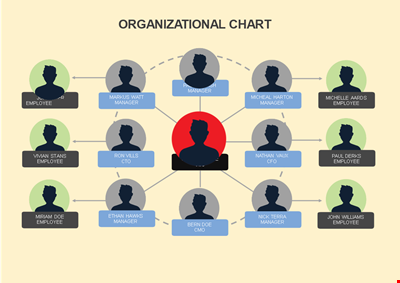
Organizational Chart Template, Editable Org Chart, Free Download
Minecraft Birthday Banner - Buy Customizable Party Decorations
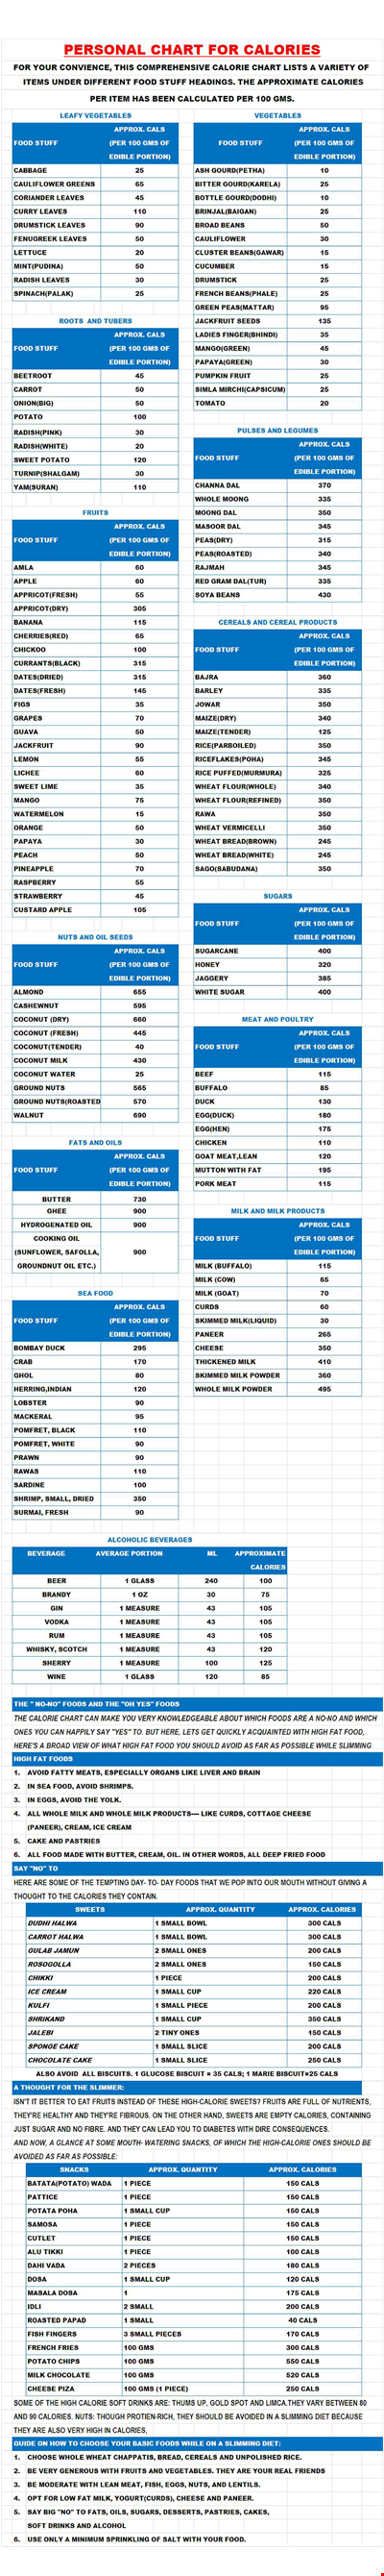
Personal Food Calorie Chart
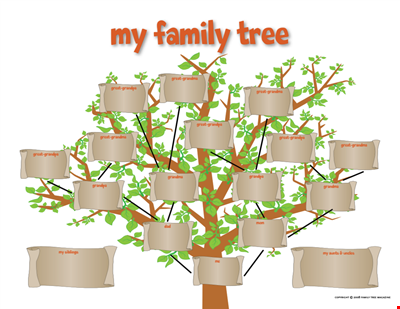
Family Tree Chart For Kids
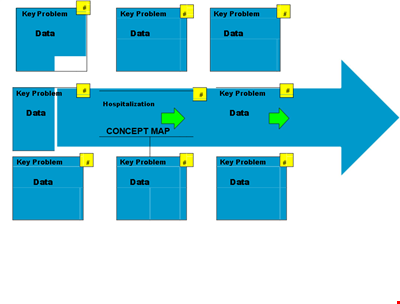
Create Organized Concepts with Our Concept Map Template - Solve Problems & Analyze Reasons
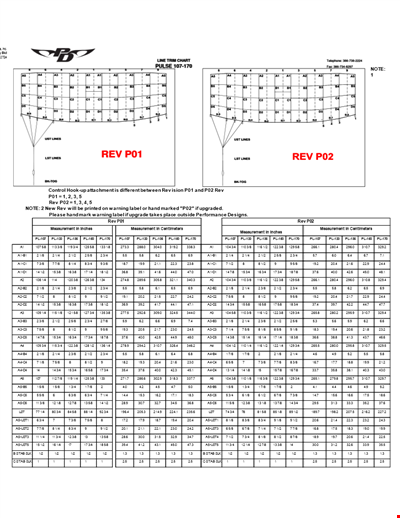
Find the Ideal Pulse Rate with Our Chord Tool
Org Chart Template Word
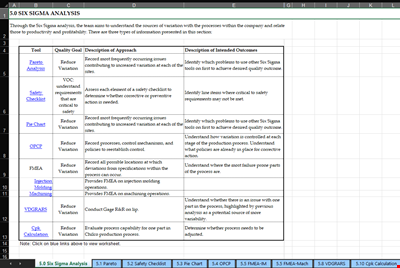
Understand and Reduce Process Variation with a Pareto Chart
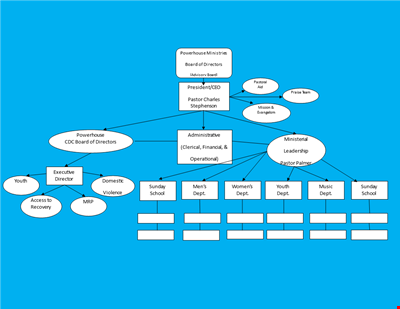
Create an Organizational Chart Template - Easily Visualize Your Company Hierarchy

Free Vintage Family Tree Template
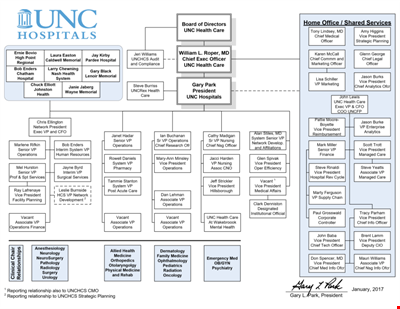
Large Hospital Organizational Chart Template - Download Now
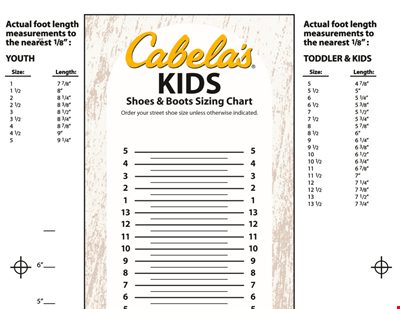
Printable Shoe Size Chart for Kids: Find the Perfect Fit for Your Little Ones