/c5be1aea-b9ef-478a-92b7-ae5d94eaa144.png "pie chart sample template Main Image")
Pie Chart Sample Template
Review Rating Score
Pie charts are widely used in business and research settings to display data in a visually appealing and easy-to-understand way. Unlike other types of charts, pie charts present data in a circular format, where the size of each slice is proportional to the value it represents. But did you know that pie charts can also be used to represent feelings? That's right — pie charts can be a useful tool for understanding the emotions of a group of people.
Using Pie Charts to Represent Feelings
In a group or team setting, it can be challenging to understand how everyone is feeling about a particular situation or decision. While some individuals may openly express their thoughts and emotions, others may be hesitant to do so. This is where pie charts come in handy — they provide a visual representation of everyone's feelings in an anonymous and non-threatening way.
To create a feelings pie chart, begin by selecting a list of emotions that are relevant to the situation or decision at hand. Then, ask each group member to assign a percentage to each emotion based on how strongly they feel about it. For example:
- Angry: 10%
- Confused: 20%
- Anxious: 30%
- Excited: 40%
Once everyone has chosen their percentages, compile the data and create a pie chart to visualize the results. The resulting chart will show the breakdown of emotions within the group, providing insight into how everyone is feeling about the situation or decision.
Download a Pie Chart Template
If you're looking to create a pie chart for your group or team, we've got you covered! At BizzLibrary.com, we offer a wide variety of chart templates, including pie charts, that you can download for free in DOCX format. Our templates are fully customizable, allowing you to enter your data quickly and easily in a professional-looking format.
Visit our website today to download your Pie Chart template and start visualizing data like a pro! With our help, you'll be able to create charts that can help you better understand the feelings and emotions of your group, as well as presenting data in a clear and compelling way.
Is the template content above helpful?
Thanks for letting us know!
Reviews
Marya Palmer(6/24/2023) - USA
Thank you for creating it *****
Author. Content was provided by:
Camila Jones
Camila is a Creative Writing graduate from the University of Alaska Fairbanks who has made her mark in the marketing world as a former Marketing Manager at GCI Liberty. Her career has been a dynamic blend of creative storytelling and strategic marketing, where she excelled in developing impactful campaigns. She is a dedicated volunteer at Alaskan Parks, where she finds inspiration in preserving our state's natural beauty.
Follow Camila
Last modified
Our Latest Blog
- The Importance of Vehicle Inspections in Rent-to-Own Car Agreements
- Setting Up Your E-mail Marketing for Your Business: The Blueprint to Skyrocketing Engagement and Sales
- The Power of Document Templates: Enhancing Efficiency and Streamlining Workflows
- Writing a Great Resume: Tips from a Professional Resume Writer
Template Tags
Need help?
We are standing by to assist you. Please keep in mind we are not licensed attorneys and cannot address any legal related questions.
-
Chat
Online - Email
Send a message
You May Also Like
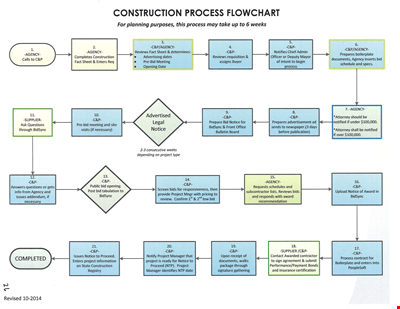
Create Professional Project Flow Charts with our Free Template
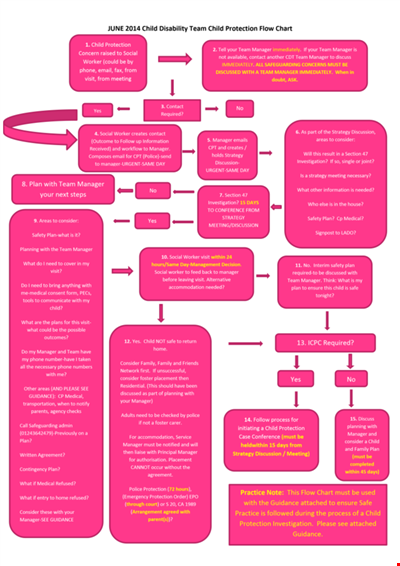
Social Event Flow Chart Template - Plan, Organize, and Execute Memorable Events
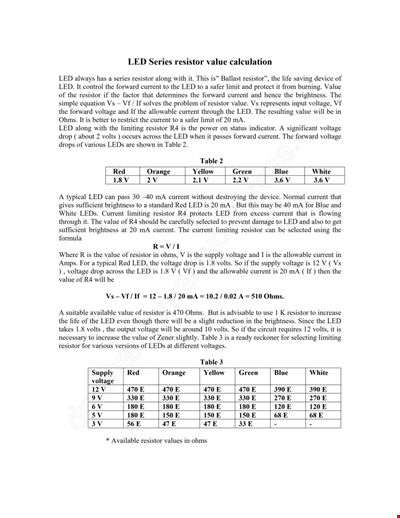
Calculation Resistor Value Chart For Led

Reward Template for Kids | Printable Behavior Chart & Chore Chart

Organizational Chart Template, Editable Org Chart, Free Download

Minecraft Birthday Banner - Buy Customizable Party Decorations
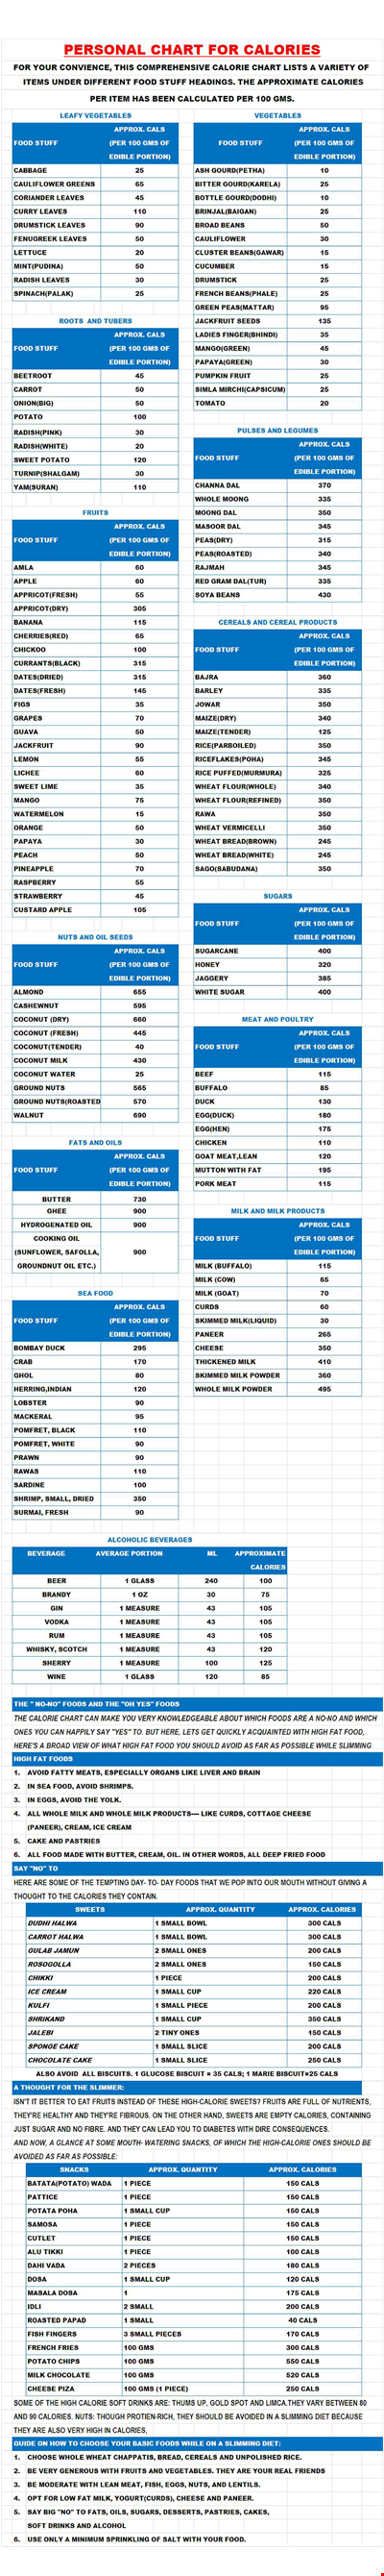
Personal Food Calorie Chart
Family Tree Chart For Kids
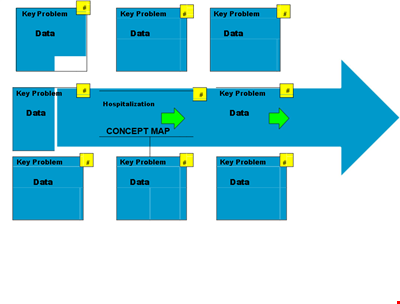
Create Organized Concepts with Our Concept Map Template - Solve Problems & Analyze Reasons
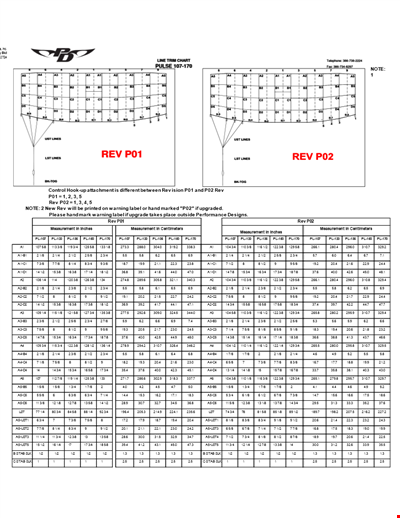
Find the Ideal Pulse Rate with Our Chord Tool
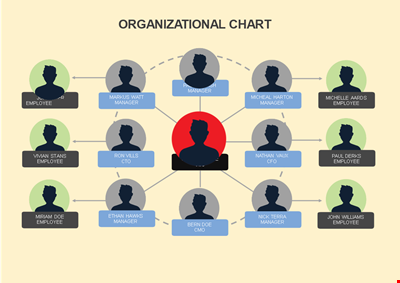
Org Chart Template Word
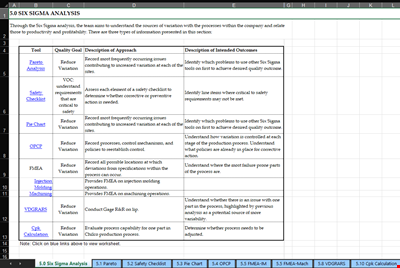
Understand and Reduce Process Variation with a Pareto Chart
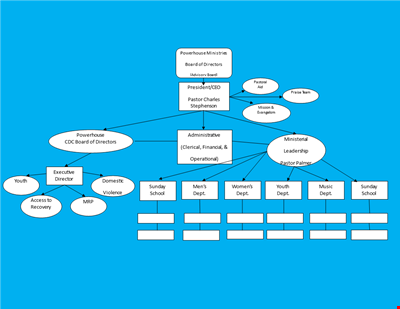
Create an Organizational Chart Template - Easily Visualize Your Company Hierarchy

Free Vintage Family Tree Template
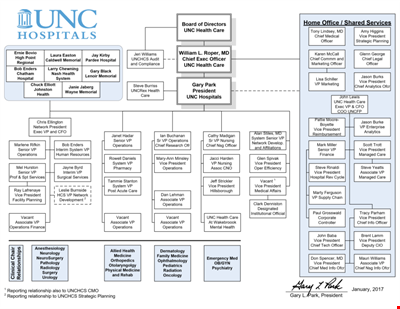
Large Hospital Organizational Chart Template - Download Now
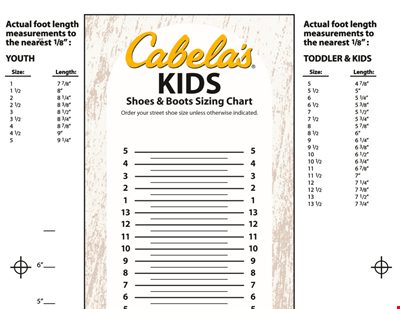
Printable Shoe Size Chart for Kids: Find the Perfect Fit for Your Little Ones