/11559994-3270-4d36-b71b-97b61438dbde.png)
Sample Waterfall Chart Excel
Review Rating Score
If you're looking to visually represent the changes in values over a period of time or across different categories, a waterfall chart is an excellent tool. At BizzLibrary.com, we have a sample waterfall chart template in Excel format available for download. Whether you're a business analyst, project manager, or student, this template can help you create insightful and impactful visualizations.
What is a Waterfall Chart?
A waterfall chart, also known as a bridge or cascade chart, is a type of column chart that illustrates how positive and negative changes in data affect the total value. It showcases the cumulative effect of different categories or factors that contribute to the overall value. This chart type is commonly used to analyze financial statements, project budgets, and sales performances.
Why Use a Waterfall Chart?
Waterfall charts provide a clear and intuitive representation of how individual elements impact the total value. Here are some key benefits of using a waterfall chart:
- Visualize Cumulative Effects: The chart allows you to see the sequential impact of positive and negative values, identifying the most significant contributors to the total.
- Highlight Trends and Patterns: By using different colors and formats, you can easily identify upward and downward trends, as well as the magnitude of each category's impact.
- Improve Data Analysis: Waterfall charts simplify complex data sets, making it easier to analyze and identify key insights. They help stakeholders understand the composition and changes in values over time or across categories.
- Enhance Presentations and Reports: With visually appealing and easy-to-interpret visuals, you can communicate your findings and make a compelling case to your audience.
Download Our Sample Waterfall Chart Excel Template
Ready to create your own waterfall chart in Excel? Head over to BizzLibrary.com and download our sample waterfall chart Excel template in XLSX format. This template comes with preformatted columns, formulas, and visual styles to help you get started quickly. Simply input your data, customize the chart as needed, and generate a professional-looking waterfall chart tailored to your specific needs.
Visit BizzLibrary.com today to explore our extensive collection of Excel templates, including charts, graphs, financial models, and more. Empower your data analysis and presentation skills with our easy-to-use resources!
Is the template content above helpful?
Thanks for letting us know!
Reviews
Carlotta Vincent(9/19/2023) - DEU
Precisely the right contnt for my problem
Last modified
Our Latest Blog
- The Importance of Vehicle Inspections in Rent-to-Own Car Agreements
- Setting Up Your E-mail Marketing for Your Business: The Blueprint to Skyrocketing Engagement and Sales
- The Power of Document Templates: Enhancing Efficiency and Streamlining Workflows
- Writing a Great Resume: Tips from a Professional Resume Writer
Template Tags
Need help?
We are standing by to assist you. Please keep in mind we are not licensed attorneys and cannot address any legal related questions.
-
Chat
Online - Email
Send a message
You May Also Like
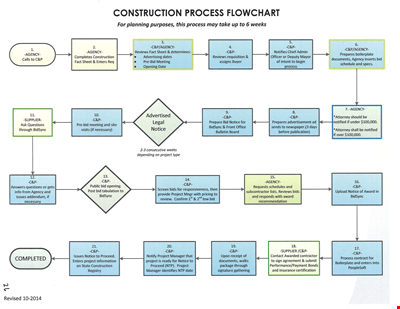
Create Professional Project Flow Charts with our Free Template
Social Event Flow Chart Template - Plan, Organize, and Execute Memorable Events
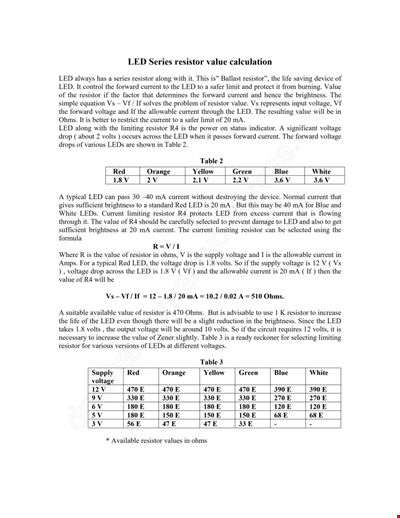
Calculation Resistor Value Chart For Led

Reward Template for Kids | Printable Behavior Chart & Chore Chart

Organizational Chart Template, Editable Org Chart, Free Download

Minecraft Birthday Banner - Buy Customizable Party Decorations

Personal Food Calorie Chart
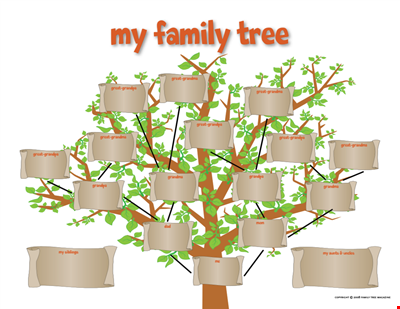
Family Tree Chart For Kids
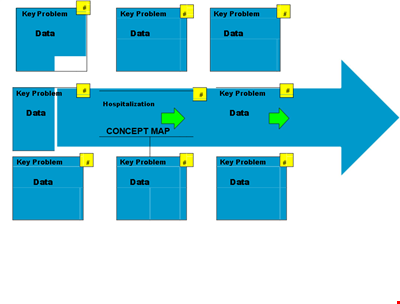
Create Organized Concepts with Our Concept Map Template - Solve Problems & Analyze Reasons
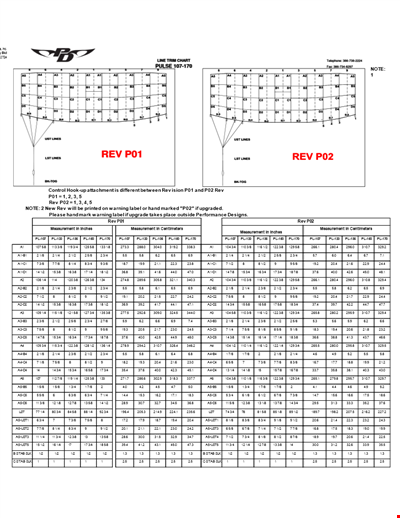
Find the Ideal Pulse Rate with Our Chord Tool
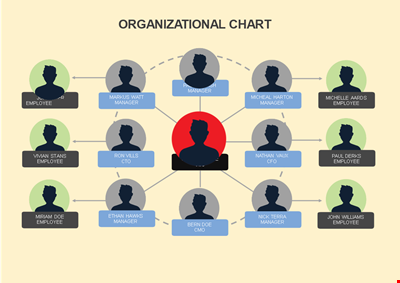
Org Chart Template Word
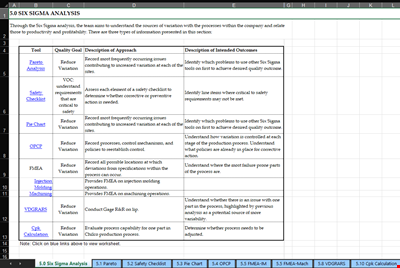
Understand and Reduce Process Variation with a Pareto Chart
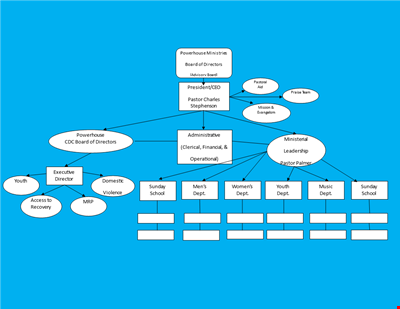
Create an Organizational Chart Template - Easily Visualize Your Company Hierarchy

Free Vintage Family Tree Template
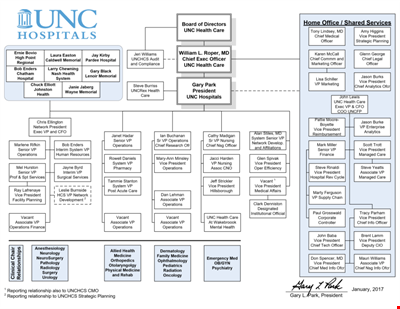
Large Hospital Organizational Chart Template - Download Now
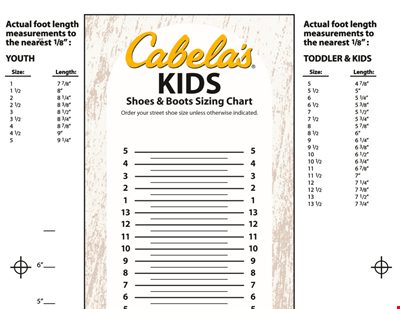
Printable Shoe Size Chart for Kids: Find the Perfect Fit for Your Little Ones