/89bcc543-8f7a-4dc7-b4d5-3a6fbaad7f45.png)
Interpreting Regression Analysis Excel
Review Rating Score
Are you working with regression analysis in Excel and need help interpreting your results? Understanding the output of a regression analysis is crucial to drawing meaningful conclusions from your data. At BizzLibrary.com, we have a comprehensive guide to help you interpret regression analysis results using Excel.
What is Regression Analysis?
Regression analysis is a statistical technique used to explore the relationship between a dependent variable and one or more independent variables. It helps to determine how changes in the independent variables affect the dependent variable. The analysis provides insights into the strength and direction of the relationship and allows for predictions based on the model.
Interpreting Regression Analysis in Excel
When performing regression analysis in Excel, you will obtain an output that includes various statistical measures and coefficients. Understanding these results is key to gaining insights into your data. Here are some important aspects of interpreting regression analysis:
- Significance: One of the first things to look for is the significance of the regression model. The p-value associated with the F-statistic determines if the overall model is significant. A small p-value suggests that the model is statistically significant and provides valuable insights.
- Coefficients: The coefficients, also known as regression coefficients or beta values, represent the estimated effects of the independent variables on the dependent variable. A positive coefficient indicates that as the independent variable increases, the dependent variable tends to increase as well, and vice versa for a negative coefficient. The significance of the coefficients is determined by their p-values.
- R-squared: The R-squared value, also known as the coefficient of determination, represents the proportion of the dependent variable's variance that is explained by the independent variables. It ranges from 0 to 1, with higher values indicating a better fit of the model to the data.
- Standard Error: The standard error measures the variability or dispersion of the residuals around the regression line. Lower values indicate a better fit of the model.
Download our Regression Analysis Excel Template
To help you easily interpret regression analysis results in Excel, we offer a downloadable Excel template (.xlsx format) that includes pre-defined formulas and functions. This template simplifies the analysis process and provides a visual representation of the regression line and scatter plot.
Visit BizzLibrary.com today and download our Regression Analysis Excel template. Empower yourself with statistical insights and make informed decisions based on your data!
Is the template content above helpful?
Thanks for letting us know!
Reviews
Kay Beasley(7/24/2023) - DEU
Great!!
Author. Content was provided by:
Elizabeth Davis
Elizabeth is from the sunny desert city of Phoenix, Arizona. She is thrilled to connect with professionals and like-minded individuals who share a passion for social technologies, content creation, and the exciting possibilities that AI brings to the world of social media. Her hobbies are hiking, climbing, and horse riding. Elizabeth has a master's degree in Social Technologies that she received at the ASU (Arizona State University). As a freelancer, she mostly contributes content related to IT. This includes articles on templates and forms provided by our community.
Follow Elizabeth
Last modified
Our Latest Blog
- The Importance of Vehicle Inspections in Rent-to-Own Car Agreements
- Setting Up Your E-mail Marketing for Your Business: The Blueprint to Skyrocketing Engagement and Sales
- The Power of Document Templates: Enhancing Efficiency and Streamlining Workflows
- Writing a Great Resume: Tips from a Professional Resume Writer
Template Tags
Need help?
We are standing by to assist you. Please keep in mind we are not licensed attorneys and cannot address any legal related questions.
-
Chat
Online - Email
Send a message
You May Also Like
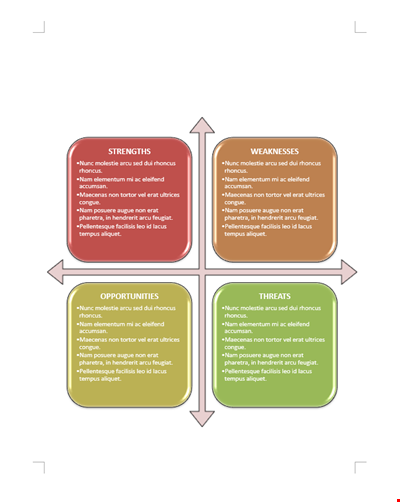
Business SWOT Analysis Template

Literary Analysis Essay Structure: HATMAT, Quote, Paragraph, Thesis Sentence
Company Situation Analysis Template - Conducting Internal and Competitive Analysis

Free Company Analysis Template - Improve Your Strategy, Analyze Stocks, and Drive Growth

Financial Analysis Template for Company Sales, Group Assets, and Ratios | Competitor Analysis
Smart Company Analysis Template - Improve your Financial Analysis with Intellidex

Service Failure Analysis Template - Analyzing System and Motor Failure with Commutator

Gap Requirements Analysis Template - Acrimas Analysis

Engineering Failure Analysis Template
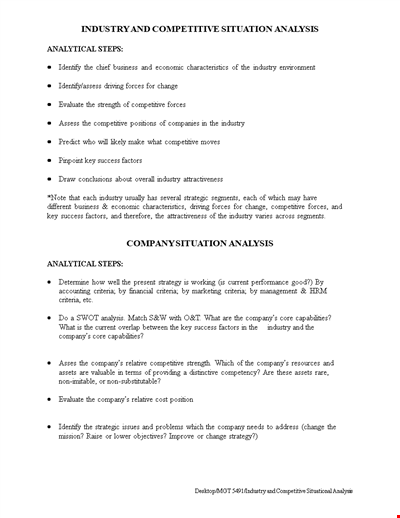
Industry & Competitive Situation Analysis

Vertical Financial Statement Analysis Example
Simple Company Analysis Template

Market Analysis Template: Get Valuable Insights for Strategic Marketing
Simple Case Analysis Template | Identify Issues, Analyze Activity
Decision Tree Algorithm Template - Efficiently Analyze Decision-Making Processes
Critical Literary Analysis Template - Analyzing and Crafting a Strong Statement